
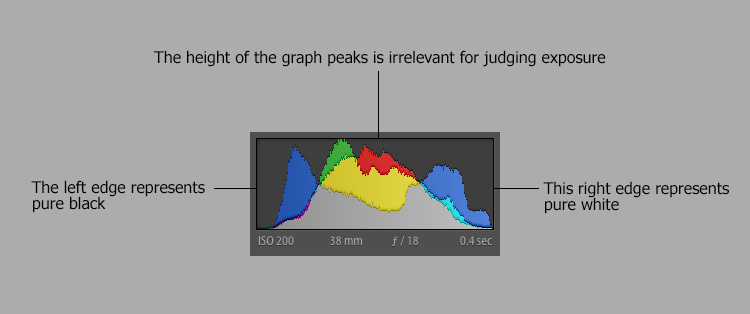
Today I’m looking back on an article I wrote on using the histogram to help judge good exposure. It’s just as relevant today as it was a few years ago when I originally wrote it. The histogram continues to be a tool I use in every stage of my workflow from capture, through processing, and printing. I still see many students who aren’t using the histogram well, in the field, and during processing. It’s an excellent guide and still the best tool to see a graphical representation of the tonal information contained in an image file. If you missed it the first time, here it is again:

Location: Bend, OR
Website: www.zschnepf.com
YouTube: https://www.youtube.com/user/zschnepf77
Instagram: https://www.instagram.com/zackschnepf/
Zack is an award winning photographer specializing in fine art landscape photography and post processing. “Art is in my blood. My father is a well known poster artist and painter. My mom was a painter, and print maker and my brother is an art director at Facebook. Art is a way of life for my family, and I will hopefully pass it on to my children as well.”
“The love of nature is also something that my family and I are passionate about. I’ve been hiking, biking, rock climbing and backpacking since I was little. From an early age, I learned to appreciate the beauty in nature.”
Recent Comments